Summer School 2022:
“Digital Humanities: Theory and Practice"
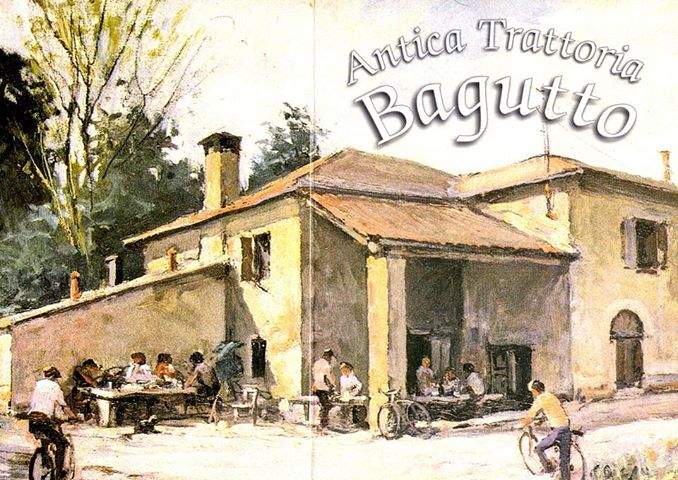
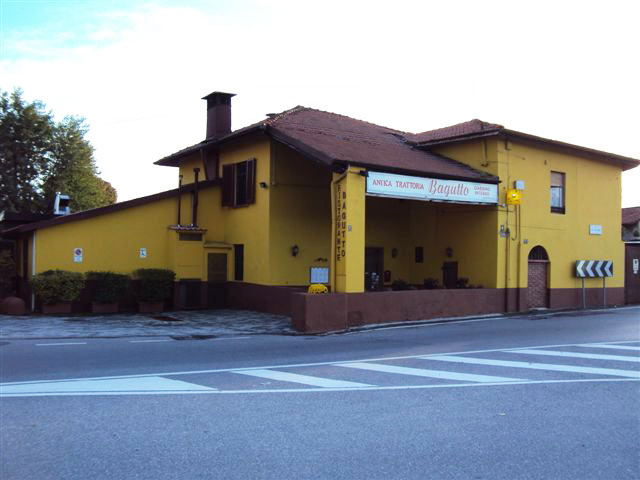
The region of Lombardy is one of the most important tourist destinations in Italy. The capital of the region is Milan which is known to be a major fashion destination in the world and is also known to the country’s second capital. Apart from Milan too there are plenty of famous tourist destinations in the region like Pavia, Mantua, Cremona and Bergamo and lakes Iseo, Maggiore, Como and Lake Garda. Apart from being one of top tourist regions in the country, it is also an important economic center since the region has plenty of important industries in Italy. Almost all cities, towns and even small villages have outdoor and flea markets, antique shops where visitors would be able to find many locally made products and various other historical handicrafts.
Many people are not aware of historical shops, this project conveys the information that can fascinate the readers about these historical shops. We collected data from government websites and added all geographical points on the map to find the location of a particular store.
Visualization is an increasingly key tool to make sense of rows with generated data. Data visualization helped us to tell stories by curating data into a form easier to understand, highlighting the trends and outliers. Also, good visualization tells a story, removes the “noise” from data, and highlights useful information. However, it’s not simply as easy as just dressing up a graph to make it look better or adding the “info” part of an infographic. Effective data visualization is a delicate balancing act between form and function.
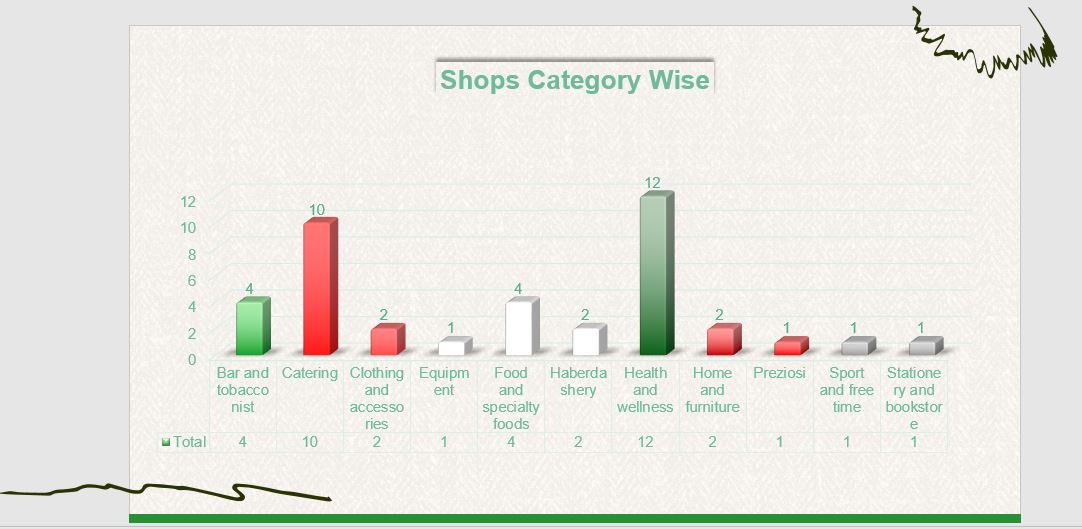
According to our research of antique shops in the Lombardy region, we have reduced 2,398 rows and divided them into groups by cities, years, types, locations, and categories. Thus, we simplified the task in order to see only the information we need.
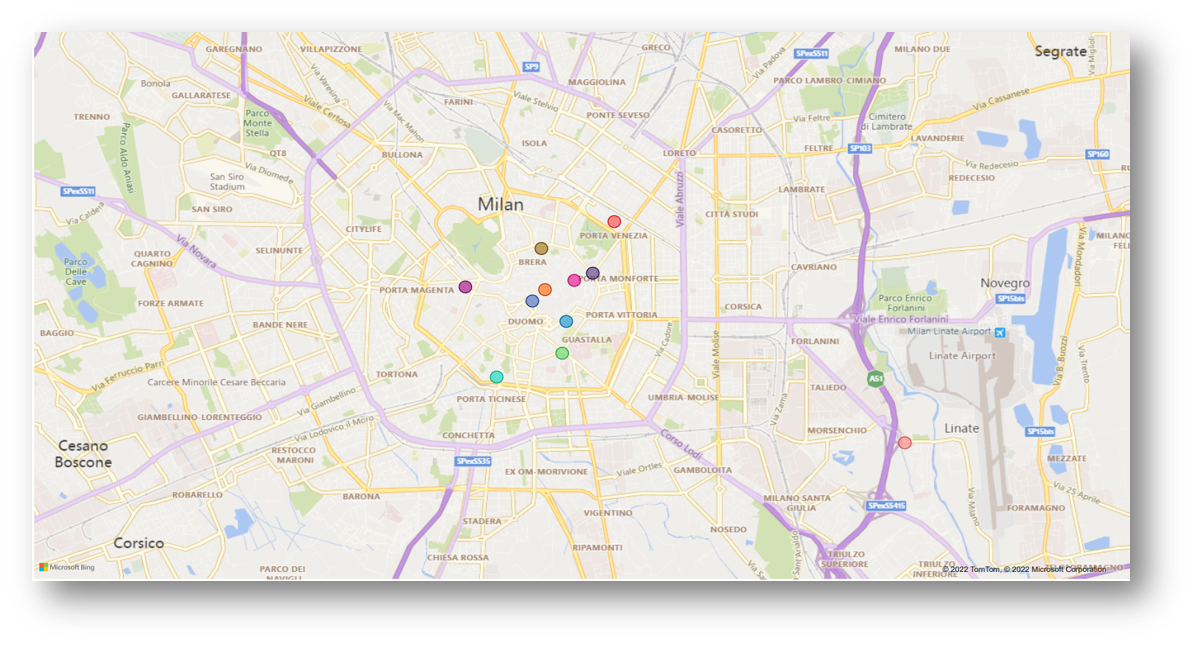
When we had a data source that contains geographic information, then created a second data source that defines the latitudinal and longitudinal values for that information data source with geographic locations, and a second data source that defines those geographic locations. Data mapping is crucial to the success of many data processes. One misstep in data mapping can ripple throughout information, leading to replicated errors, and ultimately, to inaccurate analysis. The view is below. Each mark represents an address from the original data source.
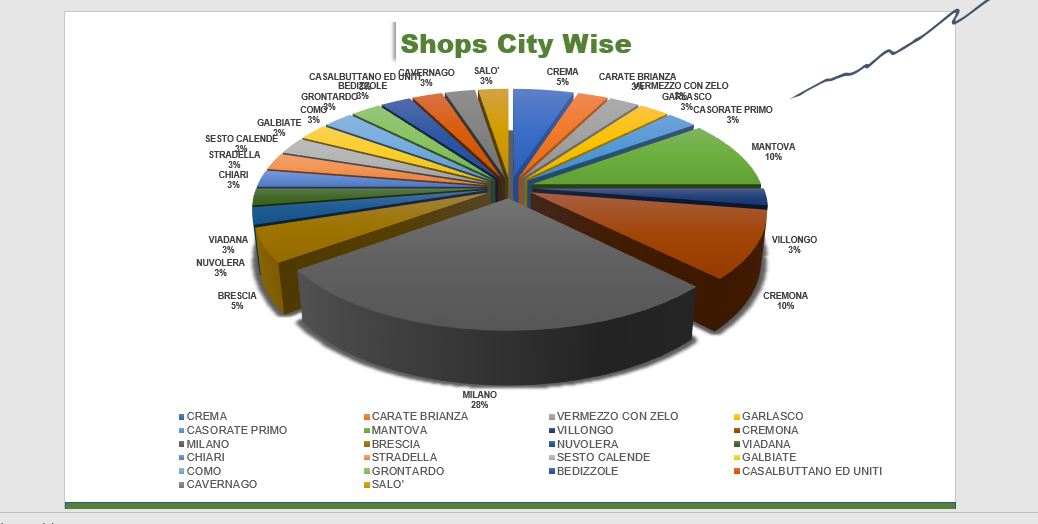
In the end, we created a pie chart with all the information and it can make the story within the data stand out. This chart helped to compare the relationship between different dimensions within a specific context. The chart splits the numerical data into percentages of the total sum. Each slice represents the proportion of the value and is measured accordingly. It converts data sources into a visual representation.
After all, our eyes are drawn to visuals, which make things more palatable and accessible. Our project made the data with historic shops of Lombardy region more natural to comprehend and therefore made it easier to identify highlights, patterns, and outliers by data cleaning, exploring data structure, detecting unusual groups, identifying trends, spotting local patterns, evaluating modeling output, and presenting results. Based on this, we can say we have achieved the main goal of the project.